

Available Carbon Accounting Features
Missing Carbon Accounting Features
Pricing
Starting Price
Options
Available Since
Deployment Options
- Web Browser (Cloud - Based)
Good Option For
- Small Business (11-50 people)
- Medium Business (51-250 people)
- Large Business (250+ people)
Deep dive
Core Features
TrucksOnTheMap takes a freight-specific approach to carbon accounting, calculating emissions at shipment level using fuel-based calculations where carrier data is available and distance-based calculations as a fallback. It follows a data-quality hierarchy of primary, modelled, and default data and applies Well-to-Wheel accounting. Its more distinctive capabilities include:
Carrier-Specific Shipment Calculations: Matches shipments with carrier-specific profiles covering vehicle type, fuel and Euro standard, while actual GPS route distances can replace generic distance assumptions.
LTL & Shared-Transport Allocation: Applies GLEC allocation rules to less-than-truckload and shared transport, helping attribute emissions where multiple shipments use the same vehicle.
Carbon Scorecards & Lane Benchmarking: Ranks carriers and freight corridors by emissions intensity in gCO2e/tkm, with trend analysis that can inform carrier procurement decisions.
Empty-Kilometre & Backhaul Analysis: Attributes emissions from empty kilometres and calculates the CO2 implications of backhaul opportunities, connecting carbon reduction with truck-utilization decisions.
Modal Shift Simulation: Compares emissions from road transport against rail and short-sea alternatives, allowing users to examine the carbon implications of changing transport modes.
Logistics-Specific Carbon Attribution: Supports detailed applications including emissions per pallet or delivery drop, reefer-versus-ambient comparisons, ADR versus non-ADR freight, heavy-load transport, and site-level attribution for multi-drop deliveries.
Closing Insights
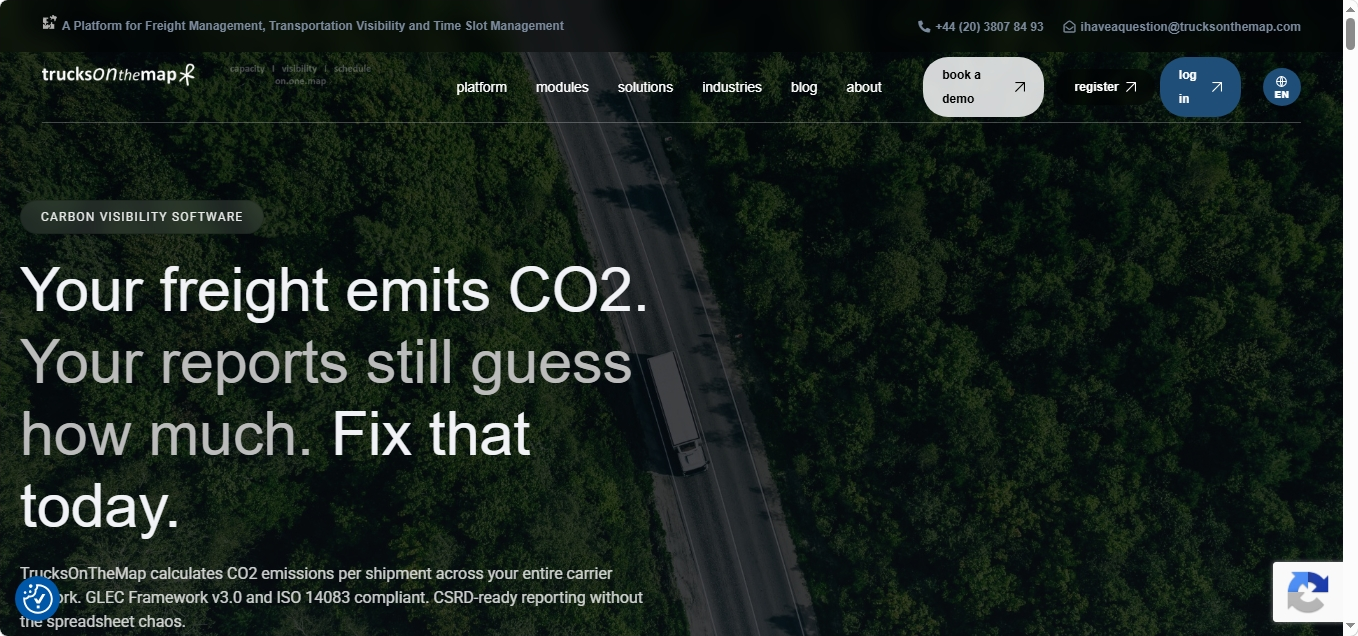
Carbon Visibility sits within TrucksOnTheMap’s wider freight-management platform, which covers freight visibility, carrier capacity, scheduling, load matching, and backhaul optimization. This operational foundation allows the software to use actual shipment and GPS route data rather than relying solely on planned distances or generic averages. Carbon Visibility turns that data into shipment-level CO2e calculations, carrier scorecards, and reporting, linking everyday freight operations with Scope 3 measurement.
This gives Carbon Visibility a more specialized focus than general-purpose carbon management platforms, particularly for companies with complex road-freight networks. Its logistics-specific data can complement broader corporate carbon accounting by providing greater detail on transport-related Scope 3 emissions and helping inform carrier, lane, and emissions-reduction decisions.